THE ABLE FOUNDATION · 2025–26
Impact &
Program Results
Program delivery, participant experience, and measured progress.
Updated September 23, 2026
REACH & DIRECT SUPPORT
Participation and funding
2025–26 reporting period
Participations across programs and events
Including the ABLE Legacy Gala. Cumulative participation, including repeat attendance.
Participant and community support
Stipends, business support, community contributions, and career resources.
| Support category | Amount |
|---|---|
| Fellow and intern stipends | $17,000 |
| Business Accelerator microgrants | $3,600 |
| Community organization contributions | $2,150 |
| Nonprofit Catalyst microgrants | $350 |
| Career development resources and services | $374 |
| Total participant and community support | $23,474 |
BACKING COMMUNITY-LED WORK
A next step for someone
who will help someone else.
One nonprofit’s filing fee funded. Through the Nonprofit Catalyst Grant, ABLE supported From Barren to Blooming with its Virginia nonprofit filing fee. Founder Lyndsey Elliott called the support an important first step in launching her organization.
ABLE’s community support has also included contributions to local nonprofits and creatives, including Eastside Raiders.
From Barren to Blooming · Grant correspondence, June 2025.
PROGRAM DELIVERY
Leadership Lab
October 11, 2025
Oxon Hill, Maryland
Five campuses.
Connections beyond the classroom.
ACCESS THAT MATTERS
Professional tools.
Experienced voices.
New connections.
Free headshots and résumé reviews, with space to learn from leaders and peers.
Talent was already there.
ABLE brought the room together.
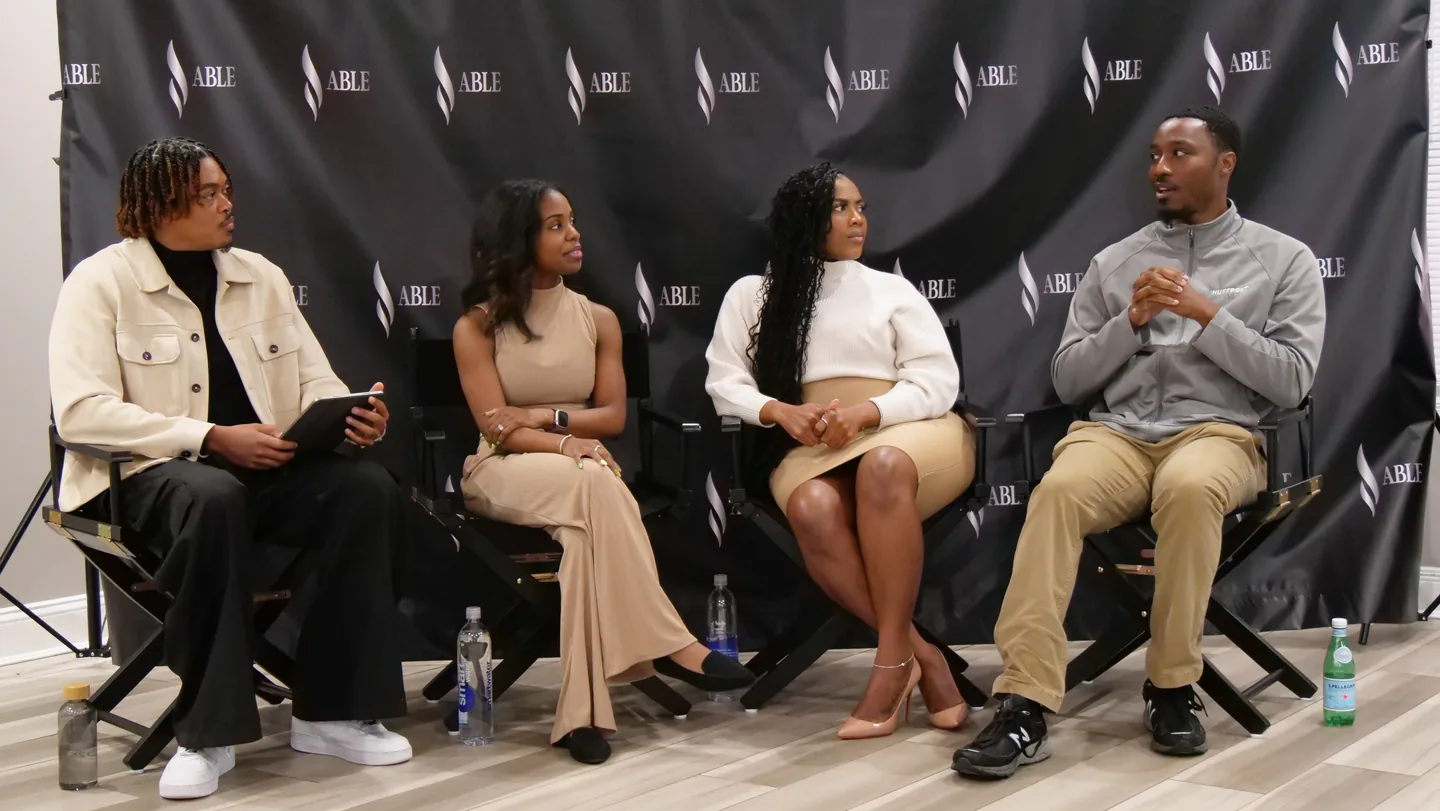
Students from the University of Maryland, College Park; University of Maryland, Baltimore; Howard University; Bowie State University; and Morgan State University came together for a day built around their next step.
Show up ready. Free professional headshots and résumé reviews gave students practical tools for their next opportunity.
Learn from people doing the work. Panel discussions brought perspectives from representatives of the NAACP, George Washington University, and the National Association of Black Journalists.
Make a real connection. Lunch provided by Chef Anthony Thomas made space to meet, exchange ideas, and build relationships across campuses.
- Free professional headshots delivered
- 30
- Students selected for follow-up career coaching
- 10
- Career development workshops delivered
- 2
Inaugural Leadership Lab · Oxon Hill, Maryland · October 11, 2025. 30 emerging leaders attended, according to ABLE’s event report.
PARTICIPANT EXPERIENCE & DEVELOPMENT
P.I.L.L.A.R. Cohort
August 2025–May 2026
15 matched assessment respondents
From finding their voice
to making things happen.
Across 10 months, from August 2025 through May 2026, participants practiced mentorship, collaboration, and responsibility. Fellows and interns practiced leadership by researching community needs, planning events, and bringing ideas into the world.
Meet the P.I.L.L.A.R. experienceWHAT GROWTH LOOKED LIKE
Coordinating peers.
Speaking with confidence.
Seeing a project through.
“Watching the ABLE Unscripted idea come to life.”
Grant Poston · A defining cohort moment, May 2026
Positive hands-on learning responses
11 selected “Strongly Agree”; 4 selected “Agree.”
Frequent application of skills
6 selected “Always”; 8 selected “Often.” One selected “Sometimes.”
Average overall competency score, entry to program end.
Five-point scale · 15 matched respondents
Competency assessment results
Average scores on a five-point scale, using matched entry and end-of-year responses.
| Domain | Entry | End | Change |
|---|---|---|---|
| Leadership | 4.15 | 4.28 | +0.13 |
| Professional readiness | 4.31 | 4.34 | +0.03 |
| Program development | 3.99 | 4.27 | +0.28 |
| Overall | 4.15 | 4.30 | +0.15 |
BUSINESS & ECONOMIC ADVANCEMENT
Business Accelerator Series
2026 assessment records
3 matched respondents
All three matched respondents reported increased confidence identifying and reaching their ideal customer.
| Measure | Before | After |
|---|---|---|
| Identifying and reaching an ideal customer | 2.67 | 4.67 |
| Marketing and customer acquisition knowledge | 2.33 | 4.00 |
MEASUREMENT
How results are measured
How we measure program development
P.I.L.L.A.R. results compare entry and end-of-program self-assessments from 15 respondents across 17 indicators. Scores use a five-point scale, with negatively worded items reverse-scored. Experience questions are reported separately.
Business Accelerator results compare three participants’ responses to the same questions before and after the program.
What the totals include
Reach counts participation across programs and events, including repeat attendance. Financial support includes stipends, microgrants, community contributions, and career development resources and services. Event and operating costs are excluded.